Feature spotlights / Pavement Crack Segmentation
Visual segmentation comparison
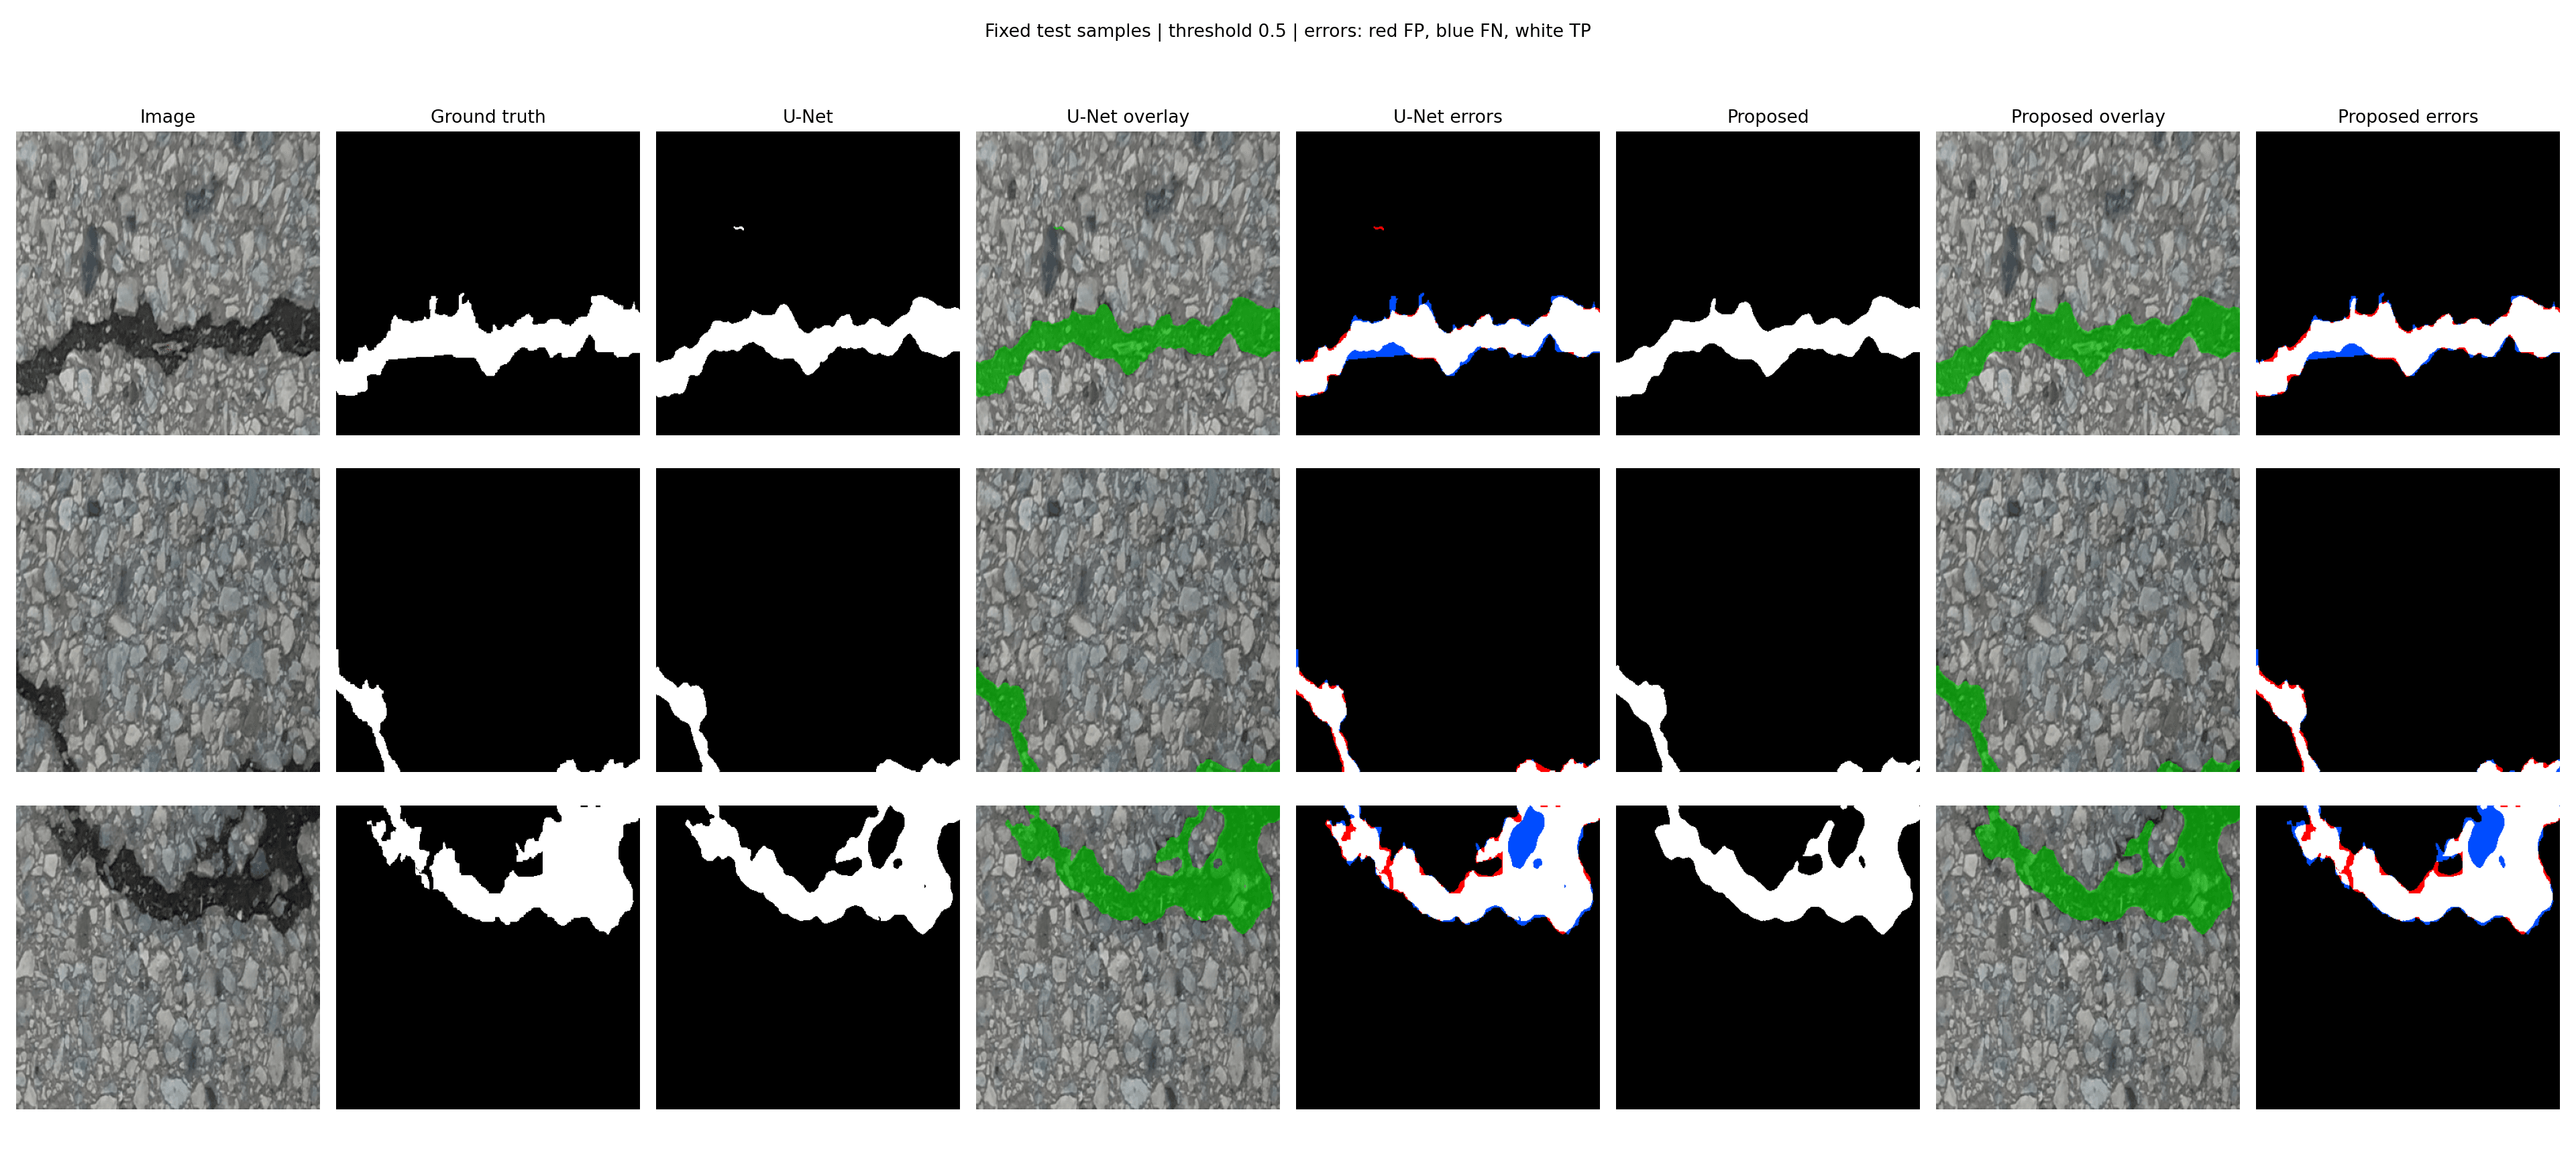
This qualitative comparison from the seed 42 experiment shows where predicted crack regions align with the reference masks. The shared sample layout supports direct visual inspection of both models.
Visual segmentation comparison
Predicted masks, overlays, and errorsPredicted masks, overlays, and errors
Three fixed test samples place the input image and ground truth beside U-Net and the proposed model. Each model includes a predicted mask, an overlay, and an error map at threshold 0.5: red marks false positives, blue false negatives, and white true positives.
Inspect crack boundaries and prediction errors on the same samples.